Survey Reveals 66% Of Households That Report Paranormal Activity Have Children
July 05, 2024 1:00 AM ‐ ParanormalGhosts
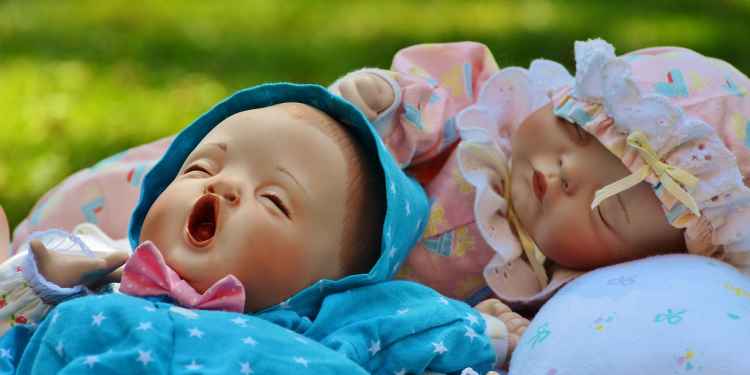
Creepy Dolls Sisters
A recent survey we conducted sheds light on the prevalence and nature of paranormal experiences reported by individuals in their homes. Given that this survey was hosted on Higgypop.com, a site dedicated to the paranormal, it naturally attracted a significant number of believers. Nevertheless, the findings provide a detailed picture of how common these occurrences are and the various factors associated with them.

A significant 96% of respondents reported experiencing something they believe to be paranormal, either in their current or previous homes. Specifically, 24% experienced paranormal activity in their current home, 42% in a previous home, and 30% in both. Only 4% of participants stated they had never encountered any paranormal phenomena.

One of the key findings from the survey is that 66% of the households experiencing paranormal activity had children living in them at the time. This suggests a strong correlation between the presence of children and the occurrence of paranormal phenomena.

When asked about the types of paranormal activities they experienced, a majority (70%) reported a mixture of activities such as apparitions, unexplained noises, and moving objects. Apparitions were experienced by 10% of respondents, unexplained noises by 4%, and objects moving by 3%. Additionally, 13% described other types of paranormal occurrences.

The frequency of these paranormal experiences varied among respondents. About 22% reported daily encounters, while 33% experienced them weekly. Another 22% had monthly experiences, and 23% said they rarely encountered such activities.

In addition to children, pets were also a common factor in households reporting paranormal activity, with 77% of respondents having pets in their homes during the occurrences.

Most respondents (53%) were living with family members during their paranormal experiences, while 33% were living with a partner or spouse. Only 6% were living alone, 1% with friends or roommates, and 8% reported other living arrangements.

The survey also explored the age of the houses where these experiences occurred. A third of respondents (33%) reported living in historic houses over 100 years old. Houses aged between 51-100 years accounted for 30% of experiences, 28% were in modern houses aged 11-50 years, and 9% were in new homes aged 0-10 years.

Regarding the religious nature of the households, 61% were not religious, and 21% were not very religious. Only 3% described their household as very religious, and 15% as somewhat religious. In terms of spiritual orientation, 37% were somewhat spiritual, 33% not very spiritual, and 18% not spiritual at all. Only 11% considered their household very spiritual.

Most respondents (83%) reported no impact from divorce or separation in their household during the paranormal experiences. Financially, 50% were getting by with challenges, while 38% were comfortable without significant worries. Only 7% sought help from a paranormal investigator, 7% from a religious figure, and none from a counsellor or therapist. A significant 85% did not seek any professional or spiritual help.

Working night shifts or having irregular sleeping patterns was a factor for 34% of respondents. Health issues, particularly those affecting sleep or mental health, were present in 24% of households. Belief in ghosts was high among respondents, with 59% definitely believing and 28% somewhat believing. Only 9% did not really believe, and 4% did not believe at all.

The survey highlights that paranormal experiences in homes are quite common, with a significant number of these occurrences happening in households with children. These experiences often occur in households with family members, pets, and in older or historic homes. While belief in ghosts is prevalent, the majority of respondents did not seek professional help, and many were experiencing financial challenges at the time. These insights provide a comprehensive view of the factors associated with reported paranormal activities in homes.

You can see the full results of our survey below, which was conducted in the winter of 2023/24 attracting 330 individual respondents.

Household Haunting Survey

Have you ever experienced something in your current or a previous home that you believe to be paranormal?


  • Yes, in my current home 24%

  • Yes, in a previous home 42%

  • Yes, in both my current and previous homes 30%

  • No, I have not experienced anything paranormal 4%

What types of paranormal activity did you experience?


  • Apparitions 10%

  • Unexplained noises 4%

  • Objects moving 3%

  • A mixture 70%

  • Other 13%

How often did you experience paranormal activities?


  • Daily 22%

  • Weekly 33%

  • Monthly 22%

  • Rarely 23%

During the time of these paranormal experiences, what were your living arrangements?


  • Living with family (parents, siblings, etc.) 53%

  • Living alone 6%

  • Living with a partner/spouse 33%

  • Living with friends/roommates 1%

  • Other 8%

How old was your house when you experienced the paranormal activities?


  • New (0-10 years) 9%

  • Modern (11-50 years) 28%

  • Older (51-100 years) 30%

  • Historic (over 100 years) 33%

Were there children living in the house at the time of the experiences?


  • Yes 66%

  • No 34%

Were there any pets in the house at the time of the experiences?


  • Yes 77%

  • No 23%

Would you say that the house was a particularly religious household at the time of these experiences?


  • Very religious 3%

  • Somewhat religious 15%

  • Not very religious 21%

  • Not religious 61%

How would you have described the spiritual orientation of your household at the time of these experiences?


  • Very spiritual 11%

  • Somewhat spiritual 37%

  • Not very spiritual 33%

  • Not spiritual 18%

During the time of these paranormal experiences, how did divorce or separation impact your household?


  • I was personally going through a divorce/separation 6%

  • Another adult in the household was going through a divorce/separation 0%

  • I was a child in the household, and my parents had previously divorced/separated 12%

  • No divorce or separation impact 83%

Thinking back to the time of these paranormal experiences, how would you describe the financial situation of your household?


  • Struggling financially 7%

  • Getting by, but with financial challenges 50%

  • Comfortable, without significant financial worries 38%

  • Financially well-off 5%

Did you seek professional or spiritual help due to these experiences?


  • Yes, a counsellor/therapist 0%

  • Yes, a paranormal investigator 8%

  • Yes, a priest or other religious figure 7%

  • No 85%

Did anyone in the household work night shifts or have irregular sleeping patterns at the time of these experiences?


  • Yes, regularly 20%

  • Yes, occasionally 14%

  • No 66%

Were there any ongoing health issues in the household at the time, particularly those that might affect sleep or mental health?


  • Yes, sleep-related issues 4%

  • Yes, mental health-related issues 13%

  • Yes, both sleep and mental health-related issues 7%

  • No known issues 76%

At the time of these experiences, would you have said you believed in ghosts?


  • Definitely believed 59%

  • Somewhat believed 28%

  • Did not really believe 9%

  • Did not believe at all 4%

Our household haunting survey is still open and accepting responses. We may follow up this article if there are significant changes to the results in the future. This might naturally occur if the survey reaches a wider and more varied set of respondents.

You can help out by having your say here and sharing the survey with your friends and family, even if they're not actively interested in the paranormal, we'd love to hear about their thoughts and experiences.
Tags:

Daily Horoscopes

Sagittarius

If you have some floating aches and pains, headache or stomach ache right now, that is your body's way of saying "Hey! I need a break here!" Stress-related ailments and over-work are indicated in your chart. You need some extra... Read More